District Elections
Redistricting of Election Districts
In 2020, the Carpinteria Valley Water District Board of Directors adopted Resolution 1083, moving from an "at-large" elected board to an "election-district" elected board along with the establishment of the boundaries, identification number, and election order of each district. Adoption of the Resolution was the final step in the California Voting Rights Act (CVRA) process with the implementation of a district-based election system beginning with the November 2022 election.
Resolution 1083At the time the CVWD election-districts were being formed, the 2020 U.S. Census was underway, but the data was not yet available. CVWD, therefore, had to rely on 2010 demographic Census data to create the District divisions in such a way that they were in compliance with CVRA. In 2021, the 2020 demographic data was certified and released for use by the U.S. Census Bureau. Because of this, minor adjustments needed to be made to the 2020 approved election district maps.
After public hearings were held, Resolution 1113, adjusting the boundaries of the Director Divisions for use in elections commencing in November 2022 was adopted by the Board of Directors on April 13, 2022. These new Director Divisions and corresponding maps became effective for the 2022 elections.
Resolution 1113Below are an overview of the revised map, a blow-up of the revised map and a table of demographic data corresponding to the revised map.
Download PDF of Revised Maps and Table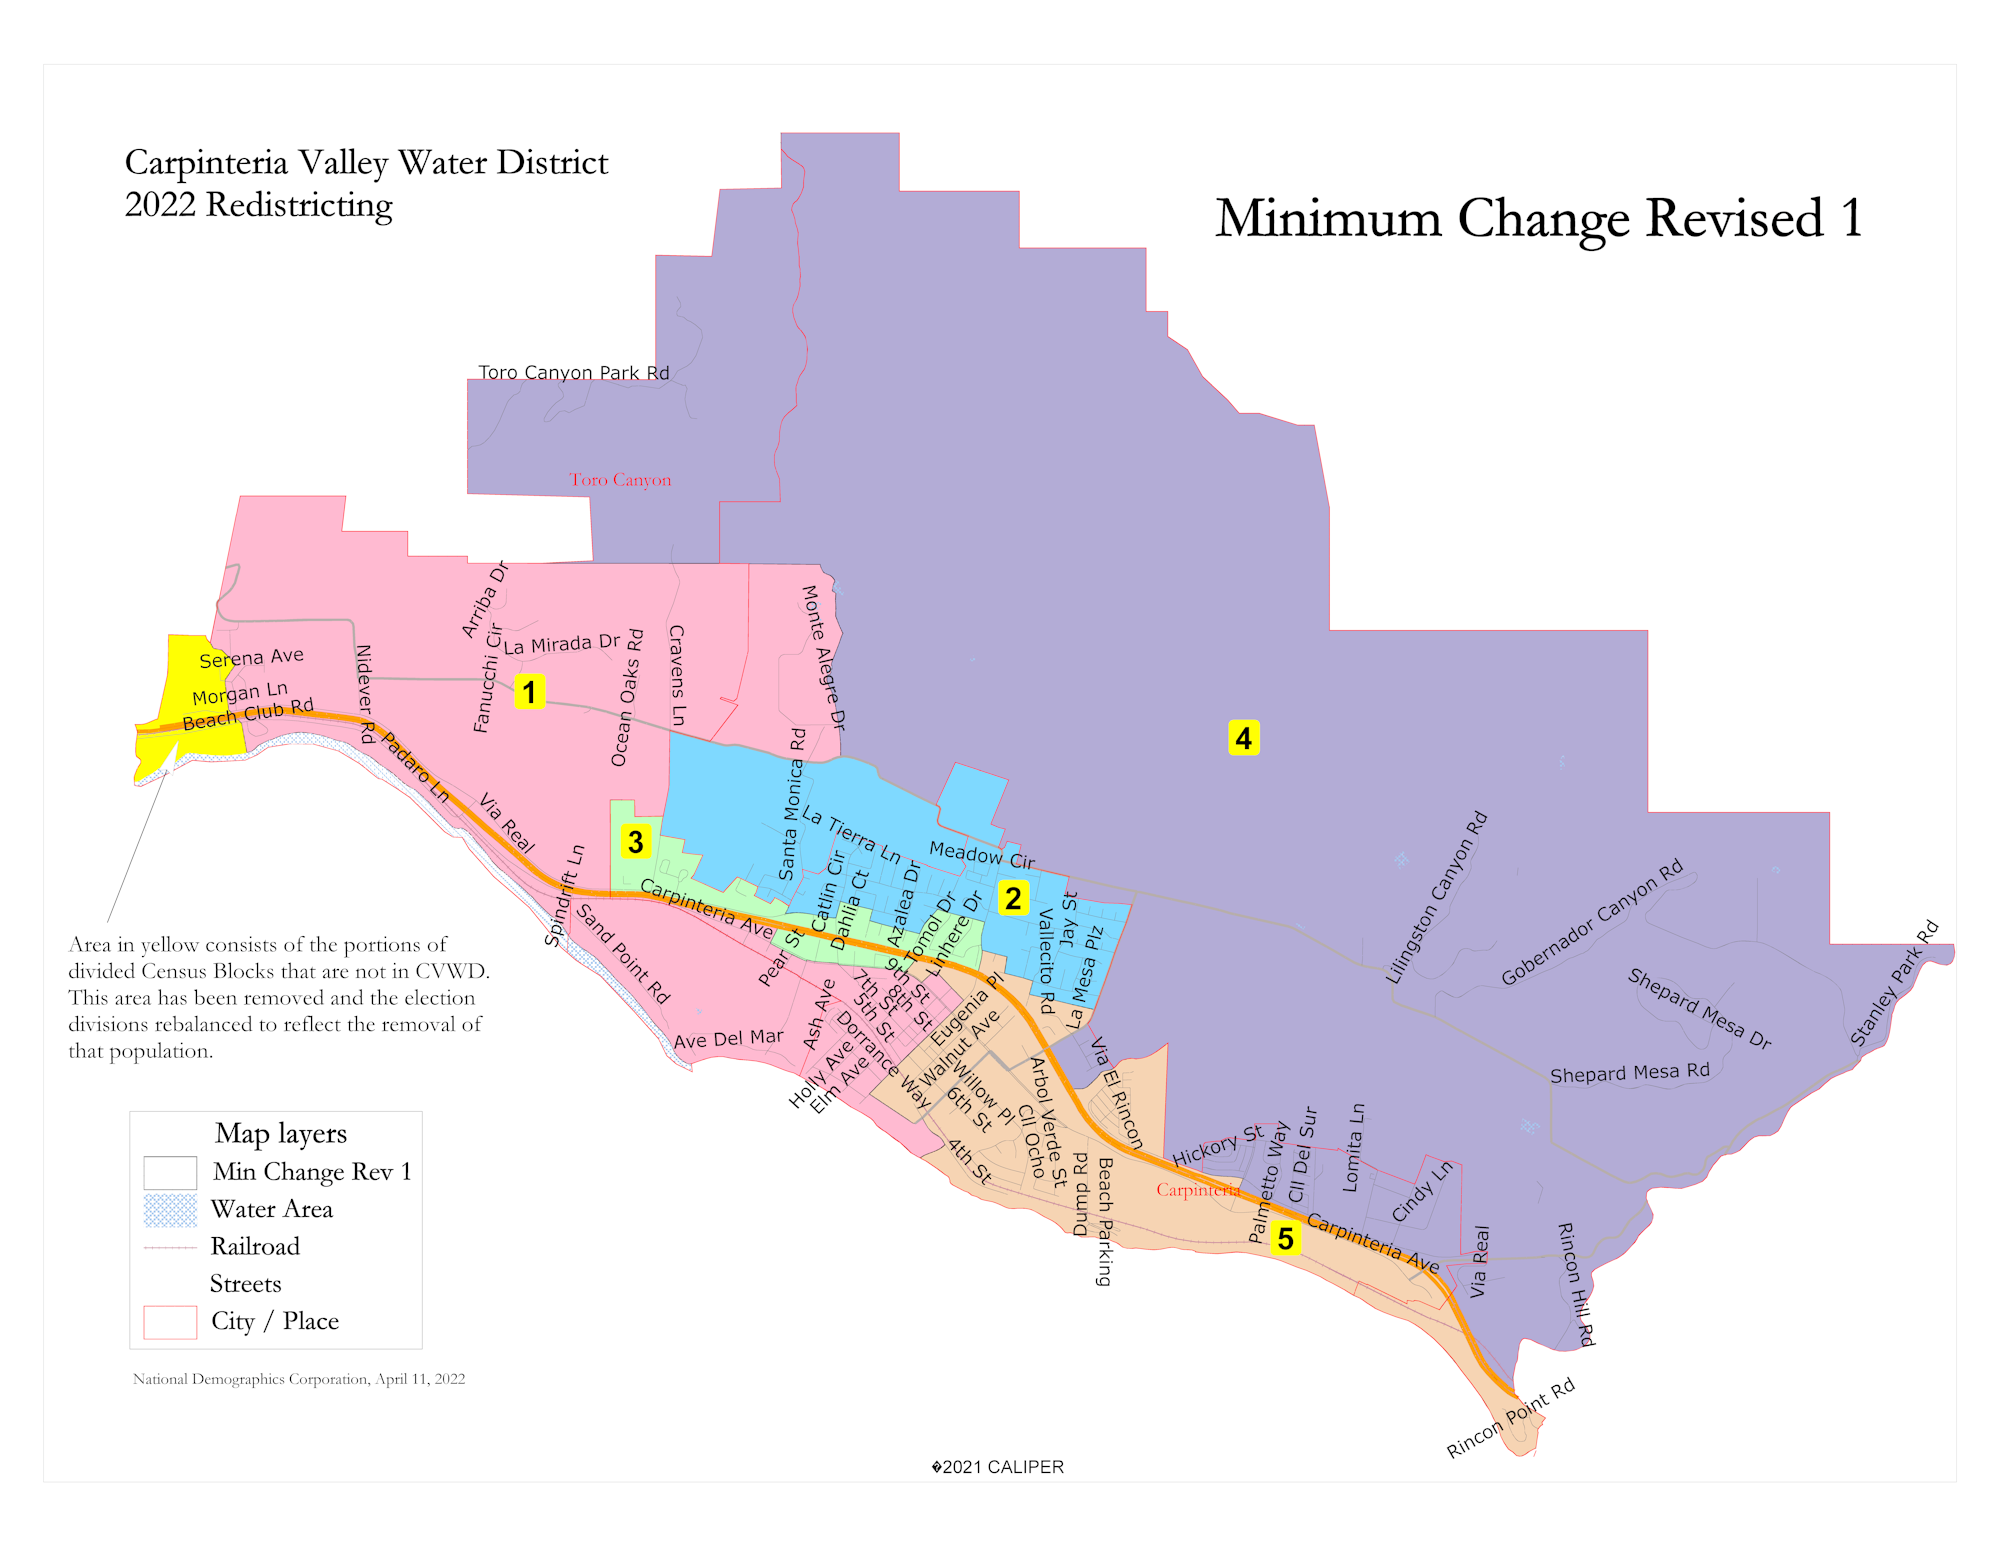
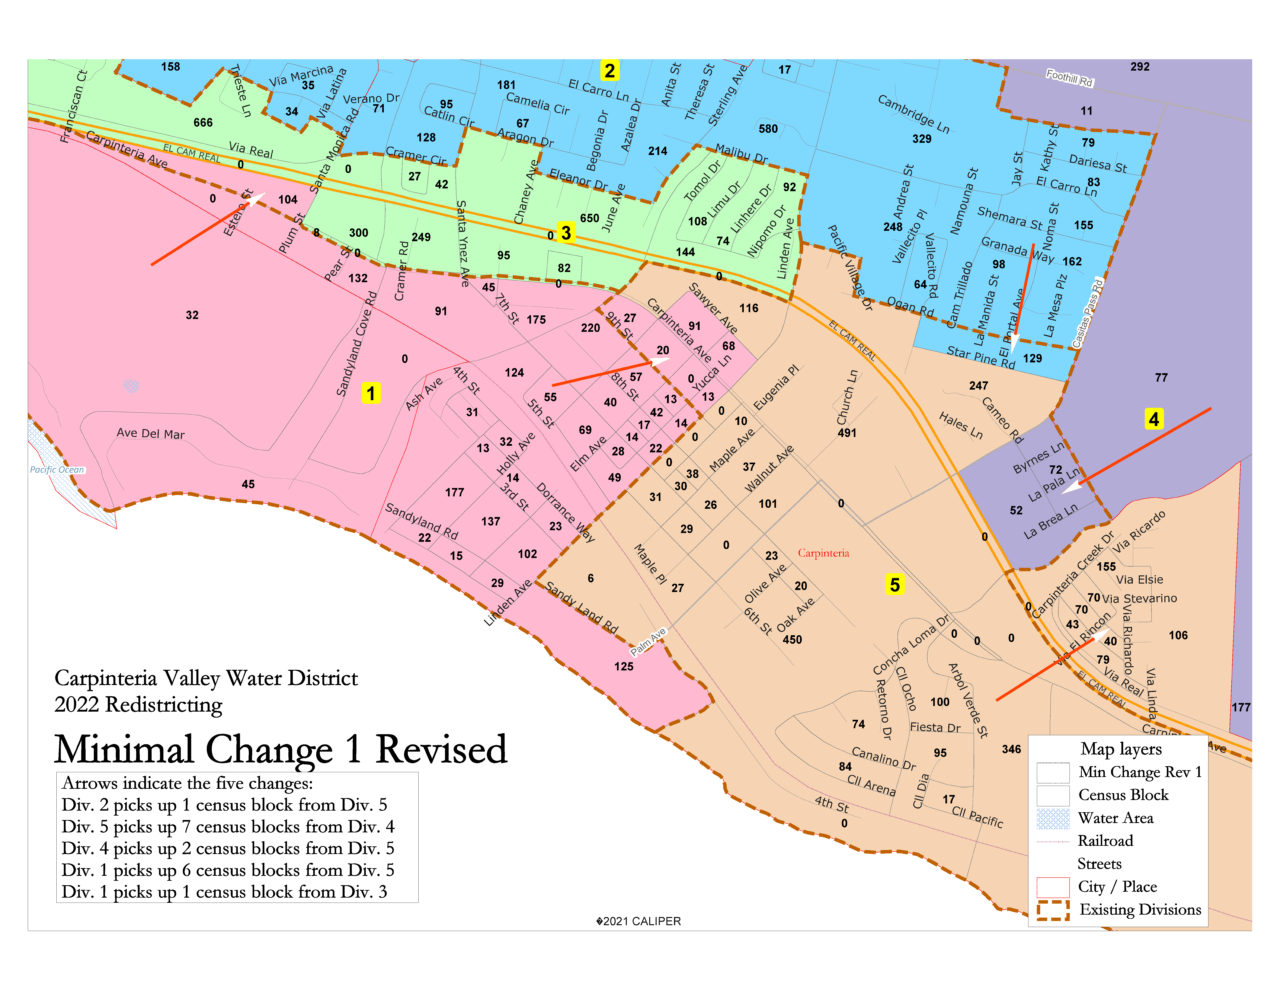
Min Change 1 Revised
| District | 1 | 2 | 3 | 4 | 5 | Total | |
|---|---|---|---|---|---|---|---|
| Total Pop | 3,128 | 3,182 | 3,176 | 3,224 | 3,022 | 15,732 | |
| Deviation from ideal | -18 | 36 | 30 | 78 | -124 | 202 | |
| % Deviation | -0.57% | 1.14% | 0.95% | 2.48% | -3.94% | 6.42% | |
| Total Pop | % Hisp | 42.3% | 37% | 63% | 44% | 41% | 45% |
| % NH White | 51% | 54% | 32% | 48% | 52% | 47% | |
| % NH Black | 2% | 1% | 1% | 1% | 1% | 1% | |
| % Asian-American | 2% | 4% | 3% | 4% | 3% | 3% | |
| Citizen Voting Age Pop | Total | 2,322 | 2,352 | 1,689 | 2,035 | 2,206 | 10,603 |
| % Hisp | 26% | 21% | 48% | 29% | 19% | 28% | |
| % NH White | 69% | 72% | 49% | 65% | 76% | 67% | |
| % NH Black | 0 | 0 | 0 | 1% | 2% | 1% | |
| % Asian/Pac.Isl. | 4% | 6% | 2% | 4% | 3% | 4% | |
| Voter Registration (Nov 2020) | Total | 1,954 | 2,241 | 1,802 | 1,914 | 1,980 | 9,891 |
| % Latino est. | 31% | 28% | 50% | 28% | 23% | 32% | |
| % Spanish-Surnamed | 29% | 26% | 45% | 25% | 21% | 29% | |
| % Asian-Surnamed | 1% | 2% | 1% | 3% | 2% | 2% | |
| % Filipino-Surnamed | 0 | 1% | 1% | 1% | 0 | 1% | |
| % NH White est. | 69% | 72% | 53% | 64% | 73% | 66% | |
| % NH Black | 0 | 0 | 0 | 7% | 2% | 2% | |
| Voter Turnout (Nov 2020) | Total | 1,705 | 2,040 | 1,543 | 1,717 | 1,789 | 8,794 |
| % Latino est. | 28% | 26% | 47% | 25% | 21% | 29% | |
| % Spanish-Surnamed | 27% | 24% | 42% | 23% | 20% | 27% | |
| % Asian-Surnamed | 1% | 2% | 1% | 3% | 2% | 2% | |
| % Filipino-Surnamed | 0 | 1% | 1% | 1% | 1% | 1% | |
| % NH White est. | 71% | 74% | 55% | 66% | 74% | 69% | |
| % NH Black | 0 | 0 | 0 | 7% | 2% | 2% | |
| Voter Turnout (Nov 2018) | Total | 1,223 | 1,621 | 1,104 | 1,303 | 1,418 | 6,669 |
| % Latino est. | 23% | 22% | 39% | 23% | 17% | 24% | |
| % Spanish-Surnamed | 22% | 2% | 36% | 21% | 15% | 22% | |
| % Asian-Surnamed | 1% | 2% | 1% | 2% | 2% | 2% | |
| % Filipino-Surnamed | 0 | 1% | 1% | 0 | 0 | 1% | |
| % NH White est. | 77% | 77% | 61% | 68% | 79% | 73% | |
| % NH Black est. | 0 | 0 | 0 | 8% | 2% | 2% | |
| ACS Pop. Est. | Total | 3,380 | 3,291 | 3,080 | 3,213 | 2,944 | 15,908 |
| Age | age0-19 | 18% | 24% | 25% | 22% | 18% | 22% |
| age20-60 | 58% | 47% | 47% | 49% | 46% | 50% | |
| age60plus | 24% | 29% | 28% | 29% | 35% | 29% | |
| Immigration | immigrants | 20% | 23% | 23% | 30% | 27% | 25% |
| naturalized | 42% | 36% | 41% | 39% | 34% | 39% | |
| Language spoken at home | english | 58% | 67% | 55% | 53% | 69% | 60% |
| spanish | 39% | 29% | 43% | 43% | 26% | 36% | |
| asian-lang | 0 | 2% | 1% | 1% | 3% | 1% | |
| other lang | 3% | 2% | 1% | 3% | 2% | 2% | |
| Language Fluency | Speaks Eng. "Less than Very Well" | 18% | 1% | 14% | 24% | 13% | 16% |
| Education (among those age 25+) | hs-grad | 37% | 44% | 37% | 36% | 44% | 40% |
| bachelor | 26% | 23% | 22% | 25% | 22% | 23% | |
| graduatedegree | 1% | 15% | 15% | 15% | 15% | 14% | |
| Child in Household | child-under18 | 21% | 30% | 32% | 30% | 23% | 27% |
| Pct of Pop. Age 16+ | employed | 72% | 64% | 63% | 64% | 59% | 64% |
| Household Income | income 0-25k | 9% | 12% | 15% | 10% | 18% | 13% |
| income 25-50k | 23% | 11% | 16% | 19% | 17% | 18% | |
| income 50-75k | 17% | 12% | 20% | 13% | 22% | 17% | |
| income 75-200k | 31% | 49% | 40% | 35% | 31% | 36% | |
| income 200k-plus | 20% | 16% | 10% | 22% | 12% | 16% | |
| Housing Stats | single family | 52% | 92% | 72% | 67% | 56% | 65% |
| multi-family | 48% | 8% | 28% | 33% | 44% | 35% | |
| rented | 59% | 28% | 41% | 31% | 53% | 44% | |
| owned | 41% | 72% | 59% | 69% | 47% | 56% |
Total population data from the 2020 Decennial Census.
Surname-based Voter Registration and Turnout data from the California Statewide Database.
Latino voter registration and turnout data are Spanish-surname counts adjusted using Census Population Department undercount estimates. NH White and NH Black registration and turnout counts estimated by NDC. Citizen Voting Age Pop., Age, Immigration, and other demographics from the 2015-2019 American Community Survey and Special Tabulation 5-year data.
Notice of Public Hearing Concerning RedistrictingAviso de Audiencias Públicas Sobre la Redistribución